
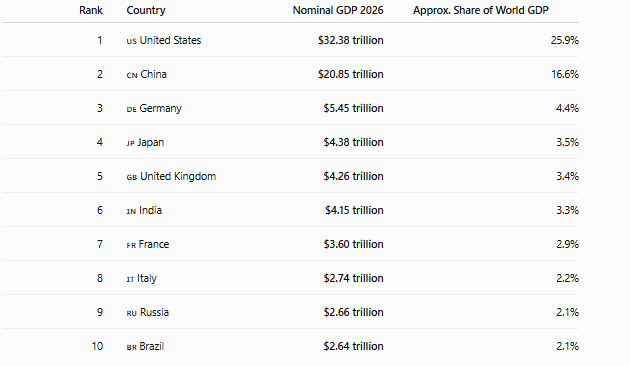
The richest countries in the world can be ranked in different ways, but the most commonly used measure is nominal GDP (Gross Domestic Product). Nominal GDP measures the total value of goods and services produced by an economy at current prices and market exchange rates.
According to the IMF World Economic Outlook (April 2026), the United States remains the world’s largest economy by nominal GDP, followed by China and Germany. India is projected to rank 6th globally, with a nominal GDP of around $4.15 trillion in 2026.
Note: The figures below are 2026 IMF projections, so they should not be interpreted as final full-year actual GDP. The IMF database is updated twice a year and projections can change with exchange rates, inflation and economic developments.
Top 10 Richest Countries by GDP in 2026
| Rank | Country | Nominal GDP 2026 | Approx. Share of World GDP |
|---|---|---|---|
| 1 | 🇺🇸 United States | $32.38 trillion | 25.9% |
| 2 | 🇨🇳 China | $20.85 trillion | 16.6% |
| 3 | 🇩🇪 Germany | $5.45 trillion | 4.4% |
| 4 | 🇯🇵 Japan | $4.38 trillion | 3.5% |
| 5 | 🇬🇧 United Kingdom | $4.26 trillion | 3.4% |
| 6 | 🇮🇳 India | $4.15 trillion | 3.3% |
| 7 | 🇫🇷 France | $3.60 trillion | 2.9% |
| 8 | 🇮🇹 Italy | $2.74 trillion | 2.2% |
| 9 | 🇷🇺 Russia | $2.66 trillion | 2.1% |
| 10 | 🇧🇷 Brazil | $2.64 trillion | 2.1% |
The top 10 economies together account for roughly two-thirds of global nominal GDP.
Top 20 Richest Countries in the World 2026
| Rank | Country | GDP 2026 |
|---|---|---|
| 1 | United States | $32.38T |
| 2 | China | $20.85T |
| 3 | Germany | $5.45T |
| 4 | Japan | $4.38T |
| 5 | United Kingdom | $4.26T |
| 6 | India | $4.15T |
| 7 | France | $3.60T |
| 8 | Italy | $2.74T |
| 9 | Russia | $2.66T |
| 10 | Brazil | $2.64T |
| 11 | Canada | $2.51T |
| 12 | Australia | $2.12T |
| 13 | Mexico | $2.12T |
| 14 | Spain | $2.09T |
| 15 | South Korea | $1.93T |
| 16 | Türkiye | $1.64T |
| 17 | Indonesia | $1.54T |
| 18 | Netherlands | $1.45T |
| 19 | Saudi Arabia | $1.14T |
| 20 | Switzerland | $1.01T |
These rankings use nominal/current-price GDP in US dollars, based on the IMF April 2026 WEO dataset.
Top 25 Countries by Nominal GDP
| Rank | Country | Approx. GDP 2026 |
|---|---|---|
| 21 | Poland | $0.98 trillion |
| 22 | Taiwan | $0.93 trillion |
| 23 | Belgium | $0.72 trillion |
| 24 | Ireland | $0.70 trillion |
| 25 | Sweden | $0.67 trillion |
The precise position of some countries can vary slightly between presentations of the IMF dataset because of rounding and subsequent revisions to exchange-rate and national-account estimates.
Top 100 richest country in the world
Top 100 Richest Countries in the World 2026
If by “richest country” you mean GDP per capita, the latest available IMF-based 2026 projections provide a useful comparison. GDP per capita is calculated by dividing a country’s GDP by its population. The figures below are nominal GDP per capita in current US dollars, not PPP.
Top 100 Richest Countries by GDP Per Capita — 2026
| Rank | Country | GDP Per Capita (US$) |
|---|---|---|
| 1 | Liechtenstein | $226,809 |
| 2 | Luxembourg | $158,733 |
| 3 | Ireland | $140,186 |
| 4 | Switzerland | $126,177 |
| 5 | Iceland | $110,048 |
| 6 | Singapore | $107,758 |
| 7 | Norway | $105,877 |
| 8 | United States | $94,430 |
| 9 | Denmark | $83,445 |
| 10 | Netherlands | $79,918 |
| 11 | Australia | $75,648 |
| 12 | Sweden | $70,676 |
| 13 | San Marino | $70,187 |
| 14 | Israel | $69,804 |
| 15 | Qatar | $68,138 |
| 16 | Austria | $67,761 |
| 17 | Germany | $65,303 |
| 18 | Belgium | $65,112 |
| 19 | United Kingdom | $61,056 |
| 20 | Canada | $60,305 |
| 21 | Finland | $60,130 |
| 22 | United Arab Emirates | $54,214 |
| 23 | Malta | $53,560 |
| 24 | Andorra | $53,475 |
| 25 | France | $52,083 |
| 26 | New Zealand | $52,023 |
| 27 | Italy | $46,505 |
| 28 | Cyprus | $45,409 |
| 29 | Spain | $41,563 |
| 30 | Bahamas | $40,892 |
| 31 | Slovenia | $40,630 |
| 32 | Czechia | $39,795 |
| 33 | Saudi Arabia | $37,811 |
| 34 | Estonia | $37,718 |
| 35 | South Korea | $37,412 |
| 36 | Lithuania | $36,545 |
| 37 | Brunei | $36,288 |
| 38 | Japan | $35,703 |
| 39 | Portugal | $35,434 |
| 40 | Guyana | $33,167 |
| 41 | Kuwait | $33,164 |
| 42 | Poland | $31,336 |
| 43 | Slovakia | $31,242 |
| 44 | Croatia | $30,030 |
| 45 | Greece | $29,696 |
| 46 | Bahrain | $29,569 |
| 47 | Barbados | $29,020 |
| 48 | Latvia | $28,913 |
| 49 | Hungary | $28,430 |
| 50 | Uruguay | $27,608 |
| 51 | Romania | $25,693 |
| 52 | Bulgaria | $23,848 |
| 53 | Antigua and Barbuda | $22,448 |
| 54 | Saint Kitts and Nevis | $22,146 |
| 55 | Oman | $21,645 |
| 56 | Palau | $21,571 |
| 57 | Panama | $20,564 |
| 58 | Costa Rica | $20,299 |
| 59 | Chile | $20,240 |
| 60 | Maldives | $19,464 |
| 61 | Türkiye | $19,018 |
| 62 | Trinidad and Tobago | $18,616 |
| 63 | Russia | $18,525 |
| 64 | Seychelles | $17,675 |
| 65 | Kazakhstan | $17,503 |
| 66 | Serbia | $17,252 |
| 67 | Montenegro | $16,377 |
| 68 | Nauru | $16,053 |
| 69 | Mexico | $15,779 |
| 70 | Saint Lucia | $15,135 |
| 71 | Malaysia | $15,085 |
| 72 | China | $14,874 |
| 73 | Argentina | $14,357 |
| 74 | Mauritius | $13,812 |
| 75 | Grenada | $12,689 |
| 76 | Albania | $12,493 |
| 77 | Dominican Republic | $12,406 |
| 78 | Brazil | $12,313 |
| 79 | Turkmenistan | $12,300 |
| 80 | North Macedonia | $11,967 |
| 81 | Georgia | $11,574 |
| 82 | Belarus | $11,286 |
| 83 | Saint Vincent and the Grenadines | $11,098 |
| 84 | Peru | $10,960 |
| 85 | Bosnia and Herzegovina | $10,701 |
| 86 | Dominica | $10,459 |
| 87 | Armenia | $10,410 |
| 88 | Colombia | $10,104 |
| 89 | Gabon | $9,918 |
| 90 | Marshall Islands | $9,677 |
| 91 | Paraguay | $9,372 |
| 92 | Moldova | $9,354 |
| 93 | Suriname | $8,856 |
| 94 | Botswana | $8,490 |
| 95 | Jamaica | $8,356 |
| 96 | Equatorial Guinea | $8,152 |
| 97 | Belize | $8,134 |
| 98 | Thailand | $8,105 |
| 99 | Mongolia | $7,853 |
| 100 | Ecuador | $7,575 |
Source: IMF World Economic Outlook (April 2026), nominal GDP per capita projections. The ranking uses the IMF’s NGDPDPC indicator and rounds values to the nearest dollar.
Top 200 richest country in the world
If by “richest country” you mean GDP per capita, the most useful comparison is nominal GDP per capita (US$). The latest available IMF World Economic Outlook database is the April 2026 WEO, which provides 2026 projections. The IMF dataset covers 195 economies, so there are not actually 200 IMF-ranked economies; therefore, the table below gives the 195 economies available in the latest dataset.
According to the April 2026 IMF-based data, Liechtenstein ranks first, followed by Luxembourg, Ireland, Switzerland and Iceland. India is projected to have a nominal GDP per capita of $2,813 in 2026 and ranks 153rd among the 195 economies.
Top 195 Richest Countries/Economies by GDP Per Capita — 2026
| Rank | Country / Economy | GDP Per Capita 2026 (US$) |
|---|---|---|
| 1 | Liechtenstein | $226,809 |
| 2 | Luxembourg | $158,733 |
| 3 | Ireland | $140,186 |
| 4 | Switzerland | $126,177 |
| 5 | Iceland | $110,048 |
| 6 | Singapore | $107,758 |
| 7 | Norway | $105,877 |
| 8 | United States | $94,430 |
| 9 | Denmark | $83,445 |
| 10 | Netherlands | $79,918 |
| 11 | Macao | $76,446 |
| 12 | Australia | $75,648 |
| 13 | Sweden | $70,676 |
| 14 | San Marino | $70,187 |
| 15 | Israel | $69,804 |
| 16 | Qatar | $68,138 |
| 17 | Austria | $67,761 |
| 18 | Germany | $65,303 |
| 19 | Belgium | $65,112 |
| 20 | United Kingdom | $61,056 |
| 21 | Canada | $60,305 |
| 22 | Finland | $60,130 |
| 23 | Hong Kong | $59,640 |
| 24 | United Arab Emirates | $54,214 |
| 25 | Malta | $53,560 |
| 26 | Andorra | $53,475 |
| 27 | France | $52,083 |
| 28 | New Zealand | $52,023 |
| 29 | Portugal | $35,434 |
| 30 | Cyprus | $45,409 |
| 31 | Aruba | $42,862 |
| 32 | Bahamas | $40,892 |
| 33 | Puerto Rico | $40,650 |
| 34 | Taiwan | $42,103 |
| 35 | Spain | $41,563 |
| 36 | Slovenia | $40,630 |
| 37 | Czech Republic | $39,795 |
| 38 | Saudi Arabia | $37,811 |
| 39 | Estonia | $37,718 |
| 40 | South Korea | $37,412 |
| 41 | Lithuania | $36,545 |
| 42 | Brunei | $36,288 |
| 43 | Japan | $35,703 |
| 44 | Croatia | $30,030 |
| 45 | Kuwait | $33,164 |
| 46 | Italy | $46,505 |
| 47 | Slovakia | $31,242 |
| 48 | Poland | $31,336 |
| 49 | Hungary | $28,430 |
| 50 | Romania | $25,693 |
| 51 | Greece | $29,696 |
| 52 | Barbados | $29,020 |
| 53 | Latvia | $28,913 |
| 54 | Bulgaria | $23,848 |
| 55 | Uruguay | $27,608 |
| 56 | Montenegro | $16,377 |
| 57 | St. Kitts and Nevis | $22,146 |
| 58 | Antigua and Barbuda | $22,448 |
| 59 | Oman | $21,645 |
| 60 | Costa Rica | $20,299 |
| 61 | Palau | $21,571 |
| 62 | Panama | $20,564 |
| 63 | Maldives | $19,464 |
| 64 | Chile | $20,240 |
| 65 | Türkiye | $19,018 |
| 66 | Argentina | $14,357 |
| 67 | Trinidad and Tobago | $18,616 |
| 68 | Russia | $18,525 |
| 69 | Seychelles | $17,675 |
| 70 | Kazakhstan | $17,503 |
| 71 | Serbia | $17,252 |
| 72 | Montenegro | $16,377 |
| 73 | Nauru | $16,053 |
| 74 | Mexico | $15,779 |
| 75 | St. Lucia | $15,135 |
| 76 | Malaysia | $15,085 |
| 77 | China | $14,874 |
| 78 | Mauritius | $13,812 |
| 79 | Grenada | $12,689 |
| 80 | Albania | $12,493 |
| 81 | Dominican Republic | $12,406 |
| 82 | Turkmenistan | $12,300 |
| 83 | Brazil | $12,313 |
| 84 | North Macedonia | $11,967 |
| 85 | Georgia | $11,574 |
| 86 | Belarus | $11,286 |
| 87 | Bosnia and Herzegovina | $10,701 |
| 88 | Armenia | $10,410 |
| 89 | Peru | $10,960 |
| 90 | Colombia | $10,104 |
| 91 | Gabon | $9,918 |
| 92 | Moldova | $9,354 |
| 93 | Paraguay | $9,372 |
| 94 | Suriname | $8,856 |
| 95 | Botswana | $8,490 |
| 96 | Jamaica | $8,356 |
| 97 | Mongolia | $7,853 |
| 98 | Kosovo | $8,958 |
| 99 | Equatorial Guinea | $8,152 |
| 100 | Belize | $8,134 |
| 101 | Thailand | $8,105 |
| 102 | Azerbaijan | $7,467 |
| 103 | Ecuador | $7,575 |
| 104 | Colombia | $10,104 |
| 105 | Peru | $10,960 |
| 106 | Honduras | $3,711 |
| 107 | South Africa | $7,503 |
| 108 | Bolivia | $6,333 |
| 109 | Iraq | $5,677 |
| 110 | Ukraine | $6,980 |
| 111 | Libya | $6,962 |
| 112 | Guatemala | $6,810 |
| 113 | Fiji | $6,802 |
| 114 | Cabo Verde | $6,670 |
| 115 | Algeria | $6,628 |
| 116 | Tuvalu | $6,581 |
| 117 | Samoa | $6,455 |
| 118 | Lebanon | $6,443 |
| 119 | Bolivia | $6,333 |
| 120 | El Salvador | $6,196 |
| 121 | Jordan | $5,601 |
| 122 | Namibia | $5,573 |
| 123 | Micronesia | $5,514 |
| 124 | Indonesia | $5,362 |
| 125 | Vietnam | $5,115 |
| 126 | Morocco | $5,107 |
| 127 | Sri Lanka | $5,002 |
| 128 | Tunisia | $4,893 |
| 129 | Eswatini | $4,927 |
| 130 | Bhutan | $4,867 |
| 131 | São Tomé and Príncipe | $4,739 |
| 132 | Uzbekistan | $4,661 |
| 133 | Tanzania | $1,362 |
| 134 | Philippines | $4,443 |
| 135 | Djibouti | $4,421 |
| 136 | Vanuatu | $4,082 |
| 137 | Venezuela | $4,140 |
| 138 | Egypt | $3,904 |
| 139 | Angola | $3,754 |
| 140 | Nicaragua | $3,559 |
| 141 | Ghana | $3,314 |
| 142 | Iran | $3,415 |
| 143 | Zimbabwe | $3,199 |
| 144 | Côte d’Ivoire | $3,313 |
| 145 | Kyrgyzstan | $3,202 |
| 146 | Zimbabwe | $3,199 |
| 147 | West Bank and Gaza | $3,171 |
| 148 | Haiti | $3,079 |
| 149 | Kiribati | $3,051 |
| 150 | Mauritania | $3,033 |
| 151 | Bangladesh | $2,911 |
| 152 | Cambodia | $2,902 |
| 153 | India | $2,813 |
| 154 | Kenya | $2,714 |
| 155 | Papua New Guinea | $2,632 |
| 156 | Republic of the Congo | $2,554 |
| 157 | Laos | $2,403 |
| 158 | Solomon Islands | $2,258 |
| 159 | Cameroon | $2,125 |
| 160 | Senegal | $2,054 |
| 161 | Comoros | $1,951 |
| 162 | Tajikistan | $1,939 |
| 163 | Guinea | $1,848 |
| 164 | Zambia | $1,831 |
| 165 | Benin | $1,809 |
| 166 | Pakistan | $1,696 |
| 167 | Nigeria | $1,556 |
| 168 | Nepal | $1,548 |
| 169 | Timor-Leste | $1,520 |
| 170 | Myanmar | $1,519 |
| 171 | Uganda | $1,476 |
| 172 | Guinea-Bissau | $1,449 |
| 173 | Sierra Leone | $919 |
| 174 | Togo | $1,341 |
| 175 | Burkina Faso | $1,319 |
| 176 | Chad | $1,315 |
| 177 | Mali | $1,301 |
| 178 | Lesotho | $1,241 |
| 179 | Rwanda | $1,198 |
| 180 | Democratic Republic of the Congo | $1,122 |
| 181 | Ethiopia | $1,081 |
| 182 | Liberia | $964 |
| 183 | Gambia | $953 |
| 184 | Niger | $822 |
| 185 | Sudan | $864 |
| 186 | Somalia | $813 |
| 187 | Madagascar | $656 |
| 188 | Malawi | $733 |
| 189 | Mozambique | $632 |
| 190 | Central African Republic | $613 |
| 191 | Burundi | $546 |
| 192 | South Sudan | $488 |
| 193 | Yemen | $384 |
| 194 | Afghanistan | $448 |
| 195 | West Bank and Gaza* | $3,171 |
India in the Richest Countries Ranking 2026
India is particularly notable in the 2026 ranking. With a projected nominal GDP of approximately $4.15 trillion, India is placed 6th in the world, behind the United States, China, Germany, Japan and the United Kingdom.
India’s projected real GDP growth for 2026 is 6.5%, according to the IMF’s April 2026 WEO. This makes India one of the fastest-growing major economies despite its lower GDP per capita compared with advanced economies.
| Indicator | India 2026 |
|---|---|
| Nominal GDP | $4.15 trillion |
| Global GDP rank | 6th |
| Real GDP growth | 6.5% |
| GDP per capita | About $2,813 |
| GDP share of world economy | About 3.3% |
Richest Countries by GDP vs GDP Per Capita
It is important to understand that a country with the largest GDP is not necessarily the richest country for an individual citizen.
For example, the United States has the world’s largest total GDP, but countries such as Switzerland and Luxembourg have much higher GDP per capita. GDP per capita divides a country’s economic output by its population and is therefore a different measure of average economic output per person.
| Measure | What it tells us | Example of a leading country |
|---|---|---|
| Nominal GDP | Overall size of an economy | United States |
| GDP per capita | GDP available per person on average | Luxembourg/Switzerland |
| GDP PPP | Economy adjusted for purchasing-power differences | China |
| GDP PPP per capita | Purchasing-power-adjusted output per person | Small high-income economies |
Richest Countries by GDP PPP in 2026
If countries are ranked according to Purchasing Power Parity (PPP) rather than nominal exchange rates, the order changes considerably. PPP adjusts for differences in the prices of goods and services between countries.
The IMF-based 2026 estimates put China ahead of the United States on PPP GDP, with India also ranking among the world’s largest economies. Statista’s summary of the IMF data puts China’s 2026 PPP GDP at around $44.3 trillion, compared with about $32.4 trillion for the US and $18.9 trillion for India.
| Rank | Country | GDP PPP 2026, approx. |
|---|---|---|
| 1 | China | $44.3 trillion |
| 2 | United States | $32.4 trillion |
| 3 | India | $18.9 trillion |
| 4 | Russia | Around $7 trillion |
| 5 | Japan | Around $7 trillion |
Key Takeaways
- United States is the world’s largest economy by nominal GDP in 2026.
- China remains second by nominal GDP but is number one by GDP PPP.
- Germany ranks third by nominal GDP.
- India ranks 6th, with projected GDP of around $4.15 trillion.
- Japan and the UK occupy the 4th and 5th positions respectively.
- Saudi Arabia remains the largest Arab economy among the countries appearing near the global top 20.
- GDP rankings can change because of currency movements, inflation, economic growth and revisions to national accounts.
- The IMF projects global real GDP growth of 3.1% in 2026 and 3.2% in 2027.
Richest Countries in the World 2026-27: GDP-Wise List and Rankings
The ranking of the world’s richest countries is most commonly measured by nominal Gross Domestic Product (GDP) in current US dollars. This metric captures the total market value of all final goods and services produced within a country’s borders in a given year, converted at market exchange rates. It reflects overall economic size and global influence more than average living standards (which are better captured by GDP per capita).
Data for 2026 and projections into 2027 primarily draw from the International Monetary Fund’s (IMF) World Economic Outlook (April 2026 vintage and related updates). Global nominal GDP is estimated around $126 trillion in 2026. Rankings can shift modestly due to exchange-rate movements, growth differentials, and data revisions.
Top Economies by Nominal GDP in 2026
Here is the consensus top ranking based on IMF projections for 2026:
| Rank | Country | Nominal GDP (USD trillion) | Approx. Share of World GDP | Projected Growth (2026) |
|---|---|---|---|---|
| 1 | United States | 32.38 | ~25.9% | ~2.3% |
| 2 | China | 20.85 | ~16.6% | ~4.4% |
| 3 | Germany | 5.45 | ~4.4% | ~0.8% |
| 4 | Japan | 4.38 | ~3.5% | ~0.7% |
| 5 | United Kingdom | 4.26 | ~3.4% | ~0.8–1.3% |
| 6 | India | 4.15 | ~3.3% | ~6.5% |
| 7 | France | 3.60 | ~2.9% | ~0.9% |
| 8 | Italy | 2.74 | ~2.2% | ~0.5% |
| 9 | Russia | 2.66 | ~2.1% | ~1.1% |
| 10 | Brazil | 2.64 | ~2.1% | ~1.9% |
| 11 | Canada | 2.51 | ~2.0% | ~1.5% |
| 12–13 | Australia / Mexico | ~2.12 each | ~1.7% each | ~1.6–2.0% |
| 14 | Spain | 2.09 | ~1.7% | ~2.1% |
| 15 | South Korea | 1.93 | ~1.5% | ~1.9% |
Sources consistently list the United States as the clear leader by a wide margin, followed by China. The top 10 economies account for roughly two-thirds of global output.
Key notes on the 2026 ranking:
- The US maintains its long-standing lead, driven by technology, finance, healthcare, and consumer spending.
- China remains a distant second. Its higher growth rate continues to narrow the absolute gap gradually, though exchange-rate and structural factors (including the property sector) influence nominal figures.
- Germany holds third place as Europe’s largest economy, supported by manufacturing and exports, despite subdued growth.
- Japan and the UK occupy the next spots. Currency movements (yen and pound) affect their dollar-denominated rankings.
- India ranks sixth at around $4.15 trillion. It is the fastest-growing major economy in the group (projected ~6.5%). Earlier expectations of it overtaking Japan or the UK in 2025–26 were delayed by data revisions and rupee movements; many forecasts still see it climbing further in subsequent years.
Outlook for 2027
Projections for 2027 show continued expansion and some rank shifts among the mid-tier economies:
- United States: ~$33.8 trillion (still #1, growth ~2.1%).
- China: ~$21.9 trillion (#2).
- Germany: ~$5.6 trillion (#3).
- India: ~$4.58 trillion (rising, potentially overtaking Japan).
- Japan: ~$4.56 trillion.
- United Kingdom: ~$4.47 trillion.
- France, Italy, Brazil, and Canada follow, with Brazil and Canada also gaining ground in absolute terms.
India’s strong growth trajectory positions it to challenge for higher ranks by the late 2020s. Global GDP is expected to rise toward $132 trillion by 2027. Longer-term forecasts (to 2030–31) keep the US and China firmly in the top two positions in nominal terms, with India continuing its ascent.
GDP vs. GDP per Capita: Two Different Measures of “Richest”
Nominal GDP measures total economic size. GDP per capita (total GDP divided by population) better indicates average economic output and living standards per person.
In 2026 nominal GDP per capita rankings (IMF-based), smaller, high-income economies dominate:
- Liechtenstein leads (over $200,000).
- Luxembourg, Ireland, Switzerland, Iceland, Singapore, and Norway follow in the top tier.
- The United States ranks among the highest for large economies (~$94,000).
- Resource-rich or financial-hub nations (Qatar, Norway, Switzerland) also score highly.
By purchasing-power-parity (PPP) adjustments, which account for cost-of-living differences, China is the largest economy overall, and several high-income small states or oil producers lead per-capita lists (Singapore, Luxembourg, Ireland, etc.).
Drivers and Trends
- United States: Broad-based strength in technology (including AI-related investment), services, and domestic demand.
- China: Manufacturing, infrastructure, and exports remain central, though growth has moderated from earlier double-digit rates.
- India: Services (IT, business process outsourcing), domestic consumption, manufacturing push, and demographics support high growth.
- Europe (Germany, France, Italy, UK): Mature economies with lower growth; manufacturing (especially Germany) and services are key.
- Emerging markets: Brazil, Indonesia, Mexico, and Turkey contribute meaningfully through commodities, manufacturing, and domestic markets.
Exchange-rate fluctuations, commodity prices, geopolitical risks, trade policies, and technology adoption (particularly AI) will influence future rankings. Data revisions and different methodologies (IMF, World Bank, national statistical offices) can produce small differences across sources.
Summary
In 2026–27 the United States remains the world’s richest country by total nominal GDP, followed by China, with Germany, Japan, the UK, and India filling out the top six. India stands out for its rapid growth and upward trajectory. While total GDP highlights economic powerhouses, per-capita measures reveal high prosperity in smaller, specialized, or resource-rich economies.
These rankings evolve with growth differentials and currency movements. Official IMF World Economic Outlook updates remain the primary reference for the most consistent cross-country comparisons.
About The Author
